logo
Awesome Image

Dashboard And KPI Design

Goal-Aligned Metrics

Effective Visualization

Role-Based Insights

Our Dashboard and KPI Design service transforms data into actionable insights that support better decision-making. We help you define meaningful metrics, design clear and intuitive dashboards, and tailor reporting for different roles across the organization. By aligning KPIs to strategic objectives, ensuring visual consistency, and enabling real-time visibility, we eliminate noise and focus attention on what truly matters. With Streamliners, your ERP data is no longer just information, it becomes a reliable tool for performance tracking, operational clarity, and long-term business value.

Turning Data Into Strategic Insight

Goal-aligned metrics and intuitive dashboards that empower leaders to measure performance, guide decisions, and unlock sustained business value.

Dashboard And KPI Design

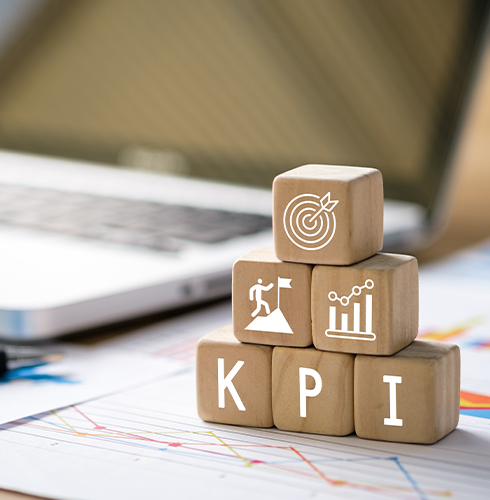
Our Dashboard & KPI Design service ensures your organization turns raw data into clear insights that drive decisions. We work closely with you to define strategic metrics, build dashboards that are intuitive and aligned to your business goals, and ensure data flows and visuals support effective monitoring. By selecting only the most relevant KPIs and visualizing them through well-chosen layouts and refresh rates, you get a dashboard that’s useful every day, not just pretty to look at. At Streamliners we deliver dashboards that reduce information overload, increase clarity, and empower teams to act swiftly and confidently.
  • Goal-Aligned KPI Selection: Choose metrics that map directly to your strategic objectives, avoiding vanity metrics and ensuring each KPI has meaning.
  • Effective Visualization Design: Use visuals that match the type of data (trends, comparisons, distributions), with clarity and consistency in layout, colour, and fonts.
  • Interactive & Role-Based Views: Design dashboards tailored for different stakeholders or roles, letting users drill down and filter based on what matters to them.
  • Real-Time Data and Refresh Cycles: Ensure dashboards use timely, synchronized data with appropriate update frequencies so that insights reflect current performance.
  • Dashboard Usability & Adoption: Focus on user experience, accessibility, minimal clutter, and training so users actually use dashboards to make decisions rather than ignore them.
Awesome Image
Go To Top